To PAN the map, use the arrow controls in the top left corner, or hold the left mouse-button while moving the mouse. To ZOOM, use the '+/-' controls below the pan controls. You can also ZOOM IN by double-clicking on the point you want centered in the map. To disable/enable the track and point layers, use the layer control in the top right corner. Mousing-over a track will cause a popup to appear with the storm name, year, and storm number (see Notes below). Clicking on a storm track will cause it to change color, and that track's data table will be opened below the map.
To open/close the data table for a given storm, click its '+' or '-' button to the left of the storm name.
I've done very little yet regarding cross-broswer support. This site is built/tested with FireFox 3. I've noticed that some other browsers (eg. Safari) drop the 'StormType' select-box below the others. Turning off the 'minimum font-size' setting in your browser and reducing font-size helps in some cases. On FireFox, you must turn off the point layer to get popups to show on the track layer.
Depending on search criteria, it can take a while to return and map the data. Be patient. If you use FireFox, you may get a message saying 'Unresponsive script.' If so, follow these short instructions at the FoxMarks Wiki.
There is a known problem with OpenLayers popups, where the popup will not be removed when the mouse leaves the feature (eg. track).
I did some cross-browser testing. IE 7 wasn't working (shocker). It's working now, but it's the slowest (by far) to process the javascript, I suggest that the filtering outputs no more than 30 tracks for IE, otherwise your browser and resources would be hurt badly. Other browsers tested were Safari, Firefox 3 and Chrome. Safari was the fastest, followed by Firefox and then Chrome (all over Windows XP), but on Firefox (as well as IE) you must turn off the point layer to get popups to show on the track layer and to select the track.
Relevant Links:
HURDAT Re-Analysis Project Data
The 'Original Format' was used for parsing and loading into this site's database.
HURDAT East and Central Pacific
The 'Original Format' was used for parsing and loading into this site's database.
IBTrACS
International Best Track Archive for Climate Stewardship hurdat tape file was used for parsing and loading into this site's database.
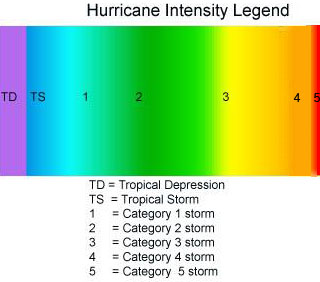
NASA Hurricane Color Legend
The color legend in this site's map was clipped from the NASA image.
MySQL 5.0.67 Database System
Free and open source; used to create and search the storm database.
PHP 5.2.6
Free and open source; used to create 'static' selectors and to interact with the database.
OpenLayers 2.10 Javascript GIS library
Free and open source; used to create and display the Google map and the storm track and datapoint layers.
Apache 2.2.9 Web Server
Free and open source; used as the site webserver.
Apache Tomcat 6.0.18 Web Service Container
Free and open source. Web application container.
Apache Axis2/Java Web Service Engine
Free and open source. Stay tuned! Will be used with Tomcat to access R-Language data analysis features.
R 2.8.1
Free and open source. Stay tuned! Will be used to access R-Language data analysis features.
Site Source Code:
create-tables.sql
MySQL script used to create the hurricane database.
ic_db_connect.php
Include file to connect to the MySQL dbms.
parse_hurdat.php
PHP program used to parse the HURDAT file and populate the hurricane database.
storm_search.php
PHP code for this initial search page.
build_query.js
Javascript code that creates the 'dynamic' form items in response to user actions.
handle_query.php
PHP code that creates/sends the MySQL query and returns storm data tables.
draw_map.js
Javascript code that creates and displays the Google map and storm tracks.
storms.css
The site-specific CSS style sheets.
mysql_distance_planar_function.source
Stored function for MySQL.